THE SOLAR CYCLE |
In the table appear different indices of activity obtained from our observations.
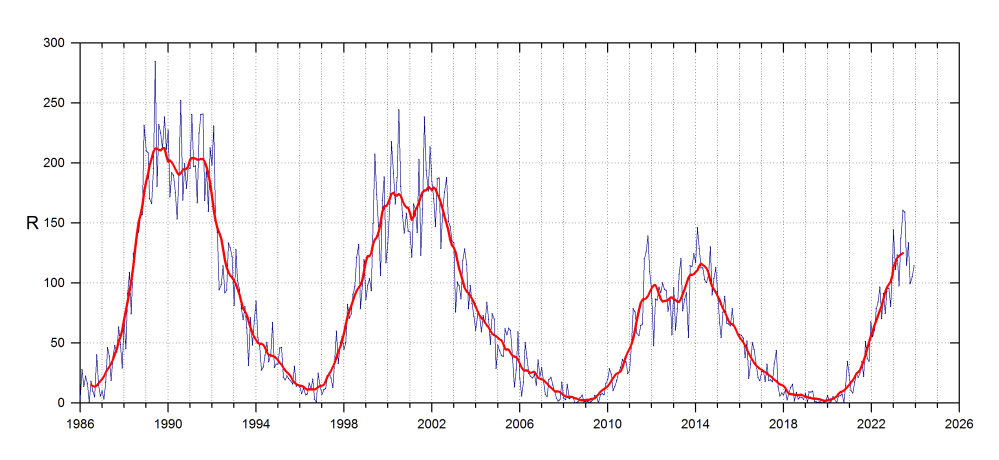
The lower graph is made from data from the SIDC (Solar Influences Data Analysis Center)
The start of cycle 23 was in May of 1996 and, at the beginning, the rise was very similar to that of the previous cycle. The maximum took place in April of the year 2000 with a smoothed Wolf number of 180.2 units. However, this was a cycle with double maximum (as already happened with the Nº22) and in 2002 the descent towards the minimum began definitively.
The minimum was longer than expected. At the beginning, the days without spots were scarce, but at the end of 2009 their number was already comparable to that of cycles 13 and 14. The minimum took place in December 2008, so the duration of cycle 23 was 12 years and 7 months, only exceeded by cycle 4, and equals that of cycle 5.
In January 2008, the first group of the new cycle appeared, in the northern hemisphere, at a latitude of about 29º. Cycle 24 was less active than the previous ones, and it has also shown a double maximum. However, it is not an atypical, or anomalous, cycle, and its level of activity fits well with the evolution of the Gleissberg cycle.
The maximum of cycle 24 was reached in April 2014 with an R (SIDC) = 116.4
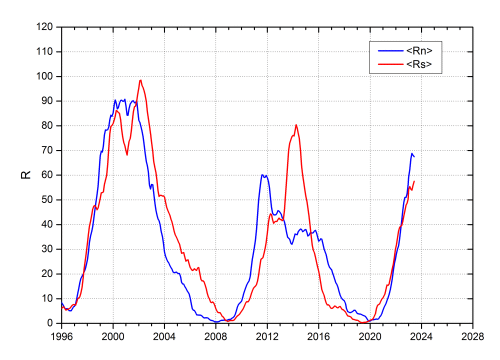
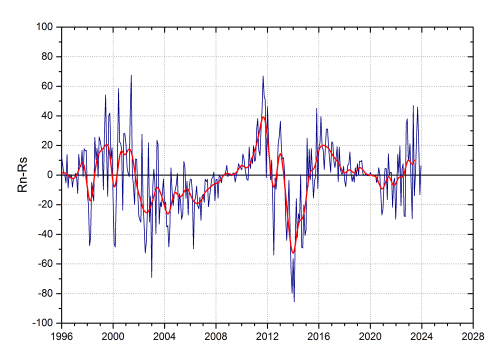
Of the two lower graphs, in the first we have represented the Wolf numbers smoothed for both hemispheres and in the second, the monthly difference Rn - Rs and the smoothed values. In this, a positive difference indicates predominance of the northern hemisphere and negative, of the south, allowing to appreciate the evolution of the asymmetry.
It should be noted that the minimum in the Northern Hemisphere was reached in December 2007, and one year later in the South. This lag was maintained in the ascending branch of cycle 24, but was reversed in 2015 and from that moment onwards, it is the southern hemisphere that has the lead. It can also be seen how activity in the south was comparable to that of the previous cycle, and that activity in the north was less intense.
 |
 |
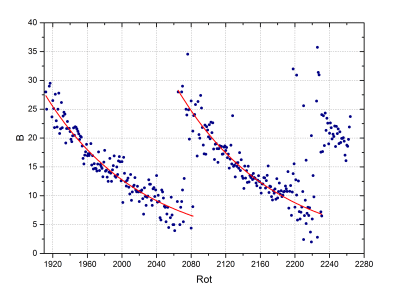
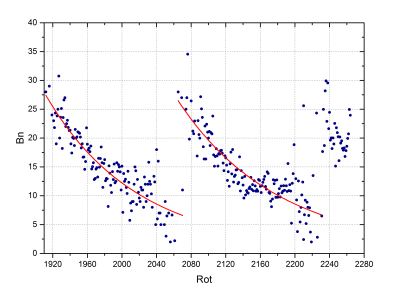
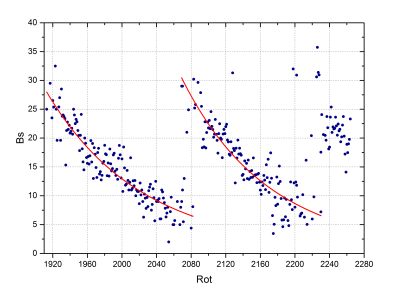
Below you can see the evolution of Spörer's law since the 1910 rotation (June 1996). The graph shows the average monthly latitude based on the solar rotations calculated for the entire Sun, and separates the groups of cycles 23 and 24. It also includes an adjustment according to a function of type B = a * Rot ^ b
 |
Separating the latitude by hemispheres shows differences between both, especially at the end of cycle 23. On the left, average latitudes in the north; and to the right in the south:
 |
 |
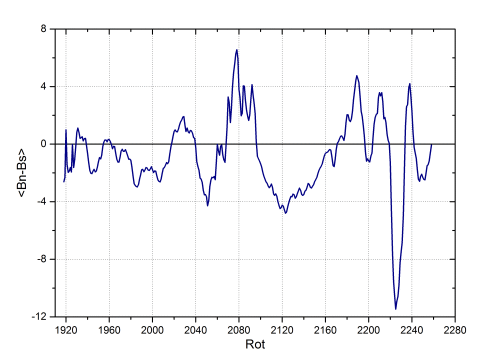
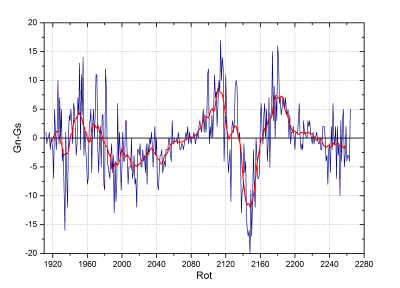
The difference in latitude between both hemispheres is known as "magnetic equator", and their smoothed values are shown in the following graph. It is very interesting to compare it with the asymmetry in the number of Wolf since, although here there is an austral predominance during great part of the time, the variations are similar during the cycle 23 indicating a correlation between both: when activity increases in a hemisphere, also its average latitude usually does. However, during cycle 24 the behavior is very different.
 |
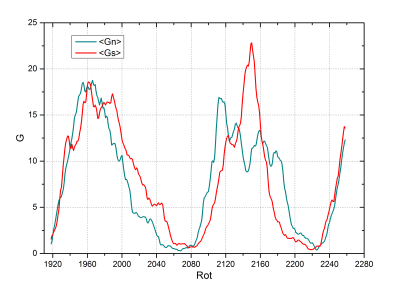
If we only count the number of groups, we have an alternative way of registering the cycle. In this case, the number of groups of both cycles is comparable, which suggests that the difference is mainly due to the fact that the groups during cycle 24 are smaller and contain fewer spots. The asymmetry is very similar to that observed in Wolf's number.
 |
 |