THE SPÖRER LAW |
In 1858, Richard Carrington discovered a behavior of sunspots that would later be studied in detail by G. Spörer. This phenomenon, known since then as Spörer's Law, consists in the displacement in latitude of the spots along the activity cycle in such a way that in their beginnings they appear in latitudes of the order of 30º, arriving in rare occasions at 45º, while at the end of the cycle they appear below 10º. In general, there is a period of time during which the spots at intermediate latitudes of the new cycle coexist with those located near the equator corresponding to the old one.
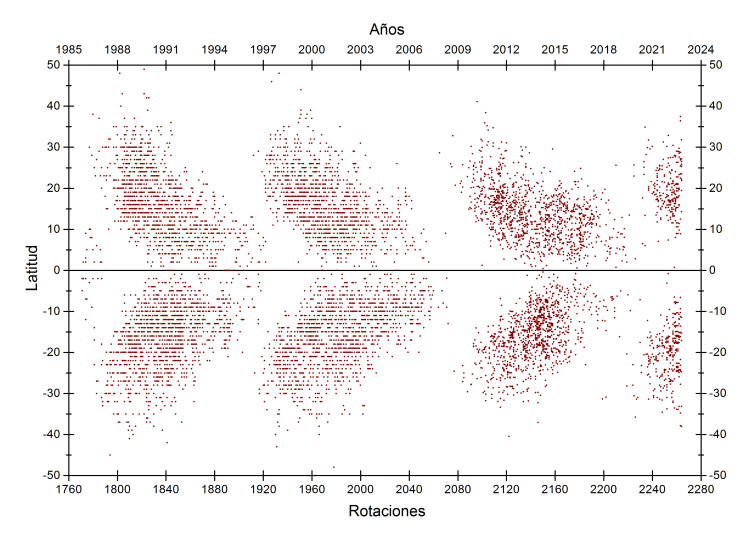
There is a very graphic way to visualize this phenomenon and it consists in representing the latitude as a function of time. The result is called Maünder diagram or "butterfly" diagram because of its shape.
 |
The graph above shows the latitude of about 7200 groups based on Carrington rotations for cycles No. 22, 23, and 24. On the left, near the equator, the last groups of cycle 21 are observed. In the first two cycles, the latitudes were obtained with templates, while with the third, photographs have been used, so it has much more resolution than the previous ones.
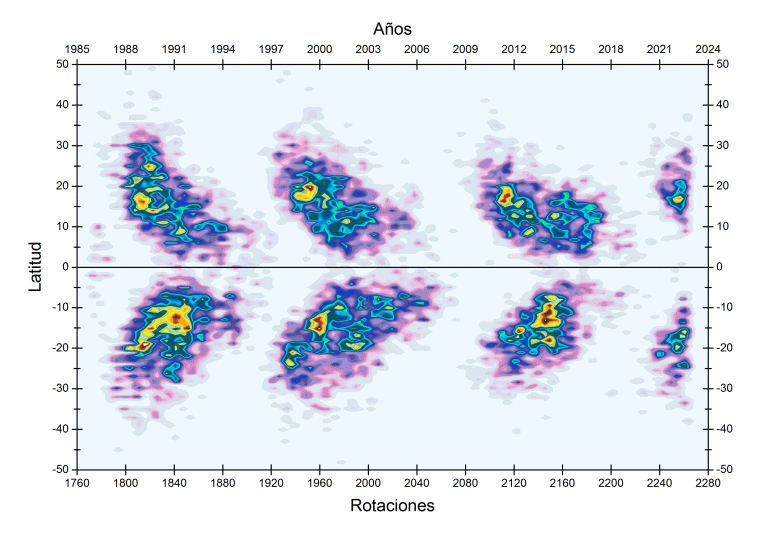
A representation with contour lines allows you to better appreciate some details:
 |
To highlight the strong asymmetry that occurred during the end of cycle 23, with a fairly strong predominance of the southern hemisphere, and early cycle 24, with predominance of the north. During the maximum, the average latitude was somewhat greater during cycle 22 than in cycle 23. This is interesting because there is an empirical relationship, cited by Waldmeier, between the mean latitude (Bm) and the maximum Wolf number of a cycle (Rm). ):
| Bm = 8º19 + 0º0699 · Rm |
Although the dispersion of the data is large, in a graph where more cycles appear, it is observed that greater activity corresponds to a greater latitude (or vice versa).