ASYMMETRY N-S |
Occasionally, activity in the Northern and Southern Hemispheres can become very different, with one predominating according to rules not yet understood. Any analysis of the activity is incomplete if you do not consider this circumstance. The asymmetry is manifested not only in the number of spots or their surface, but also in the flares, prominences, faculae, photospheric magnetic fields, solar wind, etc. The interesting thing is that there is a coherence in all these aspects, that is, when a hemisphere predominates, it does so, generally, in all facets of activity.
The existence of an N-S asymmetry usually causes a lag between both hemispheres throughout the cycle so that one of them can reach the maximum one or two years before the other. A characteristic, at once fascinating and enigmatic, is that since the cycle No.12 (around 1875) this gap follows a periodic behavior: in cycles No. 12-13-14-15 the Northern Hemisphere reached the maximum before, in the Nº 16-17-18-19 did it in South, and in the following four (Nº 20-21-22-23) it returned to anticipate the North.
The graph represents the asymmetry index (A) calculated for the annual average of the areas of spots, from 1878 to the present. The asymmetry index is defined as:
A = (N-S) / (N+S)
where N and S are any index of solar activity in the Northern and Southern Hemispheres (a positive value represents a predominance of the North). Each color represents a cycle, although it is not uncommon for the change in the asymmetry to go ahead one year. This is probably due to the period of overlap of two consecutive cycles. Straight lines are a linear adjustment of the data of each cycle, so that the change of the slope is better appreciated.
 |
During cycle 23 the Northern Hemisphere reached its maximum in October 2000, and the South in February 2002. Therefore, the behavior of the last three cycles is repeated. Will the periodic behavior be maintained by reversing the asymmetry of cycle 24?
Until the cycle is well advanced, we can not say anything for sure. However, the asymmetry during the first three years has greatly favored the northern hemisphere, which has been more or less a year ahead of the southern hemisphere. However, in 2012 the situation has been fairly balanced, and both hemispheres have had practically the same weight.
Let us also note that a period that includes 8 cycles is very similar to the Gleissberg cycle of 80-90 years, suggesting a possible relationship between the two.
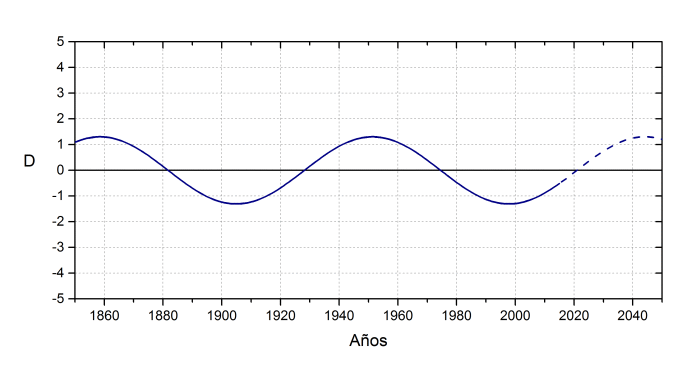
A feature that provides additional information about the asymmetry is the latitude of the magnetic equator. The magnetic equator is determined by subtracting the middle latitudes of the spots in both hemispheres (similar to an asymmetry index without normalizing). When analyzing its position over time, a secular variation appears with a period of about 93 years and an amplitude of 1.3º. The period is again similar to the Gleissberg cycle.
 |
The most interesting thing is that the gap between both hemispheres due to the asymmetry, and the position of the magnetic equator are in anticorrelation. If in a cycle, for example, the northern hemisphere reaches the maximum before, the magnetic equator will have a negative latitude. The truth is that this behavior has its logic. If the northern hemisphere reaches the maximum before, by the law of Spörer, at any time its spots will have decreased more latitude than those of the south, that is, the average latitude will be lower in the north and when subtracting, the magnetic equator will remain at south
Considering the sinusoidal adjustment made in the graph, the asymmetry will be reversed around the year 2018, at the end of the current cycle. In fact, the half-period is 46.5 years which corresponds to slightly more than 4 cycles of activity, so the change of asymmetry normally occurs every 4 cycles, but occasionally, the interval is 5 cycles. This would explain the behavior of the asymmetry in the current cycle, which remains similar to the previous 4 cycles.
References:
"On the asymmetry of solar activity"; Carbonell, M., Oliver, R., Ballester, J.L.: 1993, A&A 274, 497
"Long-term variation of sunspot latitudes"; Pentti J. Pulkkinen, John Brooke, Jaan Pelt, and Ilkka Tuominen; 1999, A&A 341, L43